Currently reading: 2013 JD Power customer satisfaction survey - full car model results
Skoda Superb and Skoda Yeti take top spots in 2013 JD Power satisfaction survey; Chevrolet Spark finishes last

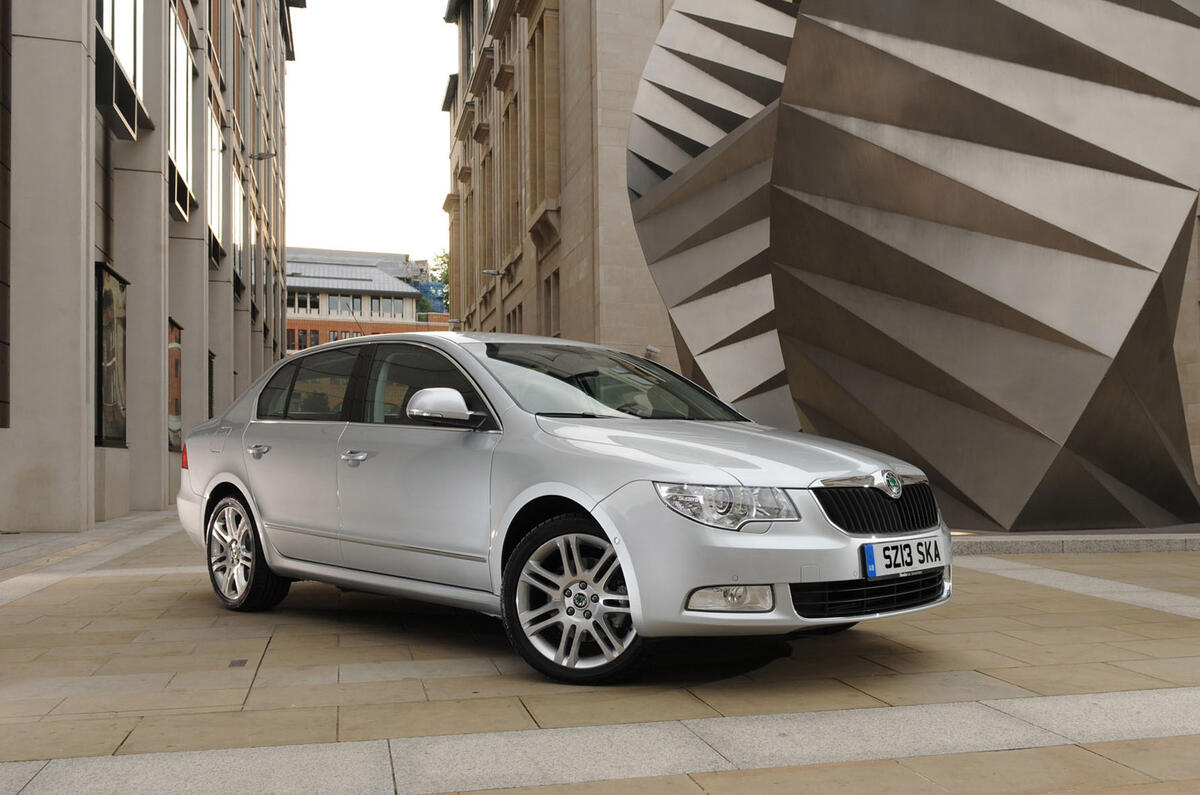
The full list of individual car model results for the 2013 JD Power survey has been released, with the Skoda Superb coming first, closely followed by the Skoda Yeti and Jaguar XF.

The result marks a breakthrough for Skoda, which trailed the Jaguar XF home last year. The Skoda Superb has moved up three places this year, with the Skoda Yeti entering the survey for the first time.

The survey of 16,000 car owners in the UK covers 116 models that are between a year and three years old. Only models with more than 4000 sales and 50 clean surveys are eligible for inclusion. In total, respondents had clocked up more than 340 million miles in their cars.

Owners rank their vehicles on 66 criteria, which are grouped to deliver an overall score. Points are accumulated to provide scores for good reliability, performance, service and running costs, which are then expressed as a percentage score.

The full list of 2013 JD Power Survey results by individual manufacturer are available by clicking here.

2013 JD Power Customer satisfaction survey - individual car model results.

1. Skoda Superb 83.0%

2. Skoda Yeti 82.8%

3. Jaguar XF 82.7%

4= Citroën DS3 82.2%

4= Lexus RX 82.2%

6= Honda Jazz 82.0%

6= Volkswagen Passat CC 82.0%

8. Volvo S60/V60 81.9%

9= Lexus IS 81.4%

9= Mercedes-Benz B-Class 81.4%

9= Toyota Prius 81.4%

12. Mercedes-Benz C-Class 81.3%

13= Kia Sportage 81.1%

13= Mercedes-Benz E-Class 81.1%

15. Saab 9-3 81.0%

16. Ford C-Max/Grand C-Max 80.9%

17= Skoda Octavia 80.8%

17= Volvo XC60 80.8%

19. Nissan Qashqai 80.7%

20. Volkswagen Tiguan 80.6%

21= Honda Civic 80.4%

21= Honda CR-V 80.4%

Back to top

23. Nissan Note 80.3%

24. Toyota Auris 80.1%

25= BMW 5-series 80.0%

25= Citroën C3 Picasso 80.0%

25= Seat Leon 80.0%

25= Volkswagen Golf Plus 80.0%

25= Volvo V70/XC70 80.0%

30. Toyota RAV4 79.9%

31. Skoda Fabia 79.8%

32= Audi A4/RS4/S4/Allroad Quattro 79.7%

32=Hyundai iX35 79.7%

32= Kia Cee'd 79.7%

32= Kia Venga 79.7%

36= Honda Insight 79.5%

36= Toyota Verso 79.5%

36=Volkswagen Scirocco 79.5%

39=Land Rover Freelander 79.4%

39= Mercedes-Benz E-Class Coupe 79.4%

39= Toyota Avensis 79.4%

39= Volkswagen Passat 79.4%

43=Ford Fusion 79.3%

43= Ford Galaxy 79.3%

45. Renault Scénic/Grand Scénic 79.1%

46. BMW 3-series 78.9%

47=Citroën C4 78.6%

47=Hyundai i20 78.6%

49=Citroën C4 Picasso 78.5%

Back to top

49=Mini Countryman 78.5%

49=Volvo C30 78.5%

52= BMW 1 Series 78.4%

52= BMW X5 78.4%

52= Volkswagen Golf 78.4%

55= Audi A5/S5/RS5 78.3%

55= Volkswagen Fox 78.3%

55= Volkswagen Polo 78.3%

58. Mercedes-Benz A-Class 78.2%

59= Ford Kuga 78.1%

59= Ford S-Max 78.1%

61= Audi TT 78.0%

61= Land Rover Discovery 78.0%

63= Peugeot 3008 77.9%

63= Volvo S40/V50 77.9%

65. Toyota Aygo 77.8%

66=Audi A3/S3/RS3 77.7%

66= Seat Ibiza 77.7%

68. Audi A6/RS6/S6/Allroad Quattro 77.6%

69= Fiat 500 77.4%

69= Mazda MX-5 77.4%

69= Smart fortwo 77.4%

69= Toyota Yaris 77.4%

73= Ford Fiesta 77.3%

73= Ford Mondeo 77.3%

73=MINI Hatch/Clubman/Convertible 77.3%

76. Audi A1 77.1%

77= BMW X3 77.0%

Back to top

77= Hyundai i10 77.0%

77= Nissan Juke 77.0%

80. Volvo XC90 76.9%

81. Ford Focus 76.8%

82=Renault Mégane 76.7%

82=Vauxhall Meriva 76.7%

84. Mazda 3 76.6%

85= Audi Q5 76.4%

85= Renault Laguna 76.4%

87= Citroën Berlingo 76.3%

87= Vauxhall Zafira 76.3%

89= Citroën C3 76.2%

89= Mazda 2 76.2%

91. Audi Q7 76.1%

92=Vauxhall Astra 76.0%

92=Vauxhall Insignia 76.0%

94=Suzuki Swift 75.9%

94=Volkswagen Touran 75.9%

96=Hyundai i30 75.8%

96=Kia Picanto 75.8%

98=Mazda 6 75.3%

98=Nissan Micra 75.3%

100. Citroën C1 75.2%

101= Renault Clio 75.1%

101= Suzuki Alto 75.1%

103. Peugeot 207 CC 75.0%

104. Peugeot 207 74.8%

105= Peugeot 308 74.6%

105= Vauxhall Corsa 74.6%

Back to top

107. Kia Rio 74.4%

108= Alfa Romeo Giulietta 74.1%

108= BMW X1 74.1%

108= Citroën C5 74.1%

111. Peugeot 107 73.9%

112. Fiat Panda 73.7%

113. Ford Ka 72.2%

114. Fiat Grande Punto/Punto Evo 72.0%

115. Alfa Romeo MiTo 70.7%

116. Chevrolet Spark 70.2

Industry Average77.6%

For more detailed analysis of the results visit www.whatcar.com


Join the debate

Comments
7
Add a comment…
steve19 24 October 2019

amazing

this survey is very accurate i guess. If one is shopping at dollar general then he should submit dgcustomerfirst survey to get a chance to win $100 dollar general gift card.

hy093knh 21 August 2019

Home Depot Survey

Do you know www.homedepot.com/survey. Do you love your home all neat beautiful and modern?  

Soren Lorenson 28 May 2013

Peugeot-Citroen

It's interesting to see how well Citroen has done whilst Peugeot, which are basically the same cars underneath has done really badly.

My personal experience was that my Citroen's were quite good cars whilst my Peugeot's were utter dogs.  I couldn't understand how this could be when they are essentially the same but clearly others have experienced this too.

Flatus senex 2 June 2013

Soren Lorenson wrote: It's

Soren Lorenson wrote:

It's interesting to see how well Citroen has done whilst Peugeot, which are basically the same cars underneath has done really badly.

My personal experience was that my Citroen's were quite good cars whilst my Peugeot's were utter dogs.  I couldn't understand how this could be when they are essentially the same but clearly others have experienced this too.

It is stranger than that even. Some Citroens and Peugeots are made at the same plant. I suspect the abilities of individual production lines may play a part. This could explain why the Skoda Fabia does relatively badly compared with the Yeti and Superb.

Of course presence or absence of "je ne sais quoi" will have a part to play in the ratings. IMHO the Jaguar, Yeti and DS3 have this rare and elusive quality which the other "top tenners" (or most of the others on the list) do not have.