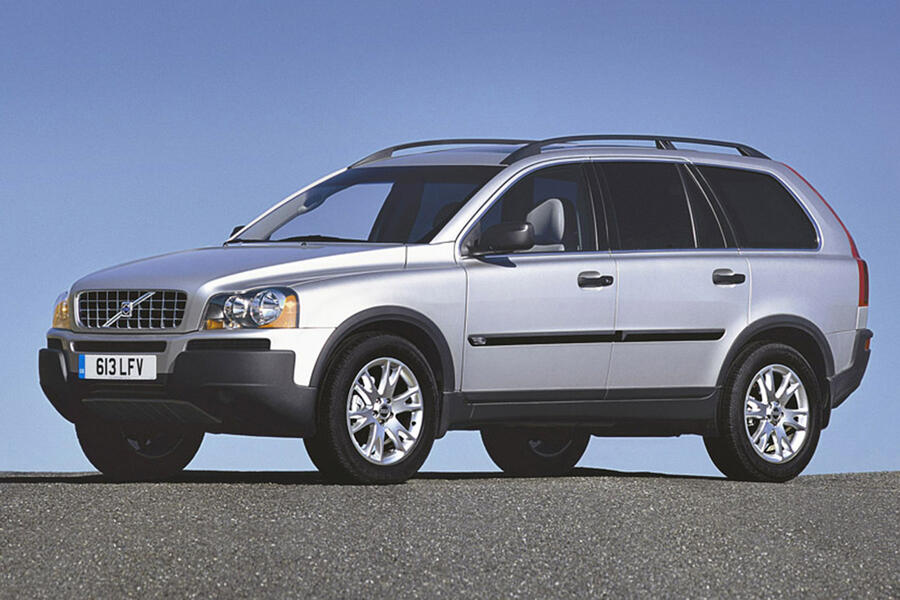
The Volvo XC90 is a distant outlier on the graph. Every dot is scattered closely around a line that shows a steady downward trend in a paper titled Influence of Aerodynamics. Every dot but one.
Covering 1955 to 2010, the graph shows Volvos consistently becoming more aerodynamically efficient – and the XC90, which arrived in 2002 and was way above the norm.
The list of examples shows why. From PV544 and Amazon through 240, 245, 760, 960, 850, S80 and V70, they’re all saloon or estate cars. The drag coefficient (Cd), a measure of slipperiness through air, gradually improved.
In the late 1950s, the PV544, a handsome two-door saloon, had a Cd of 0.50. The Amazon bettered that, with 0.48Cd. By the 1980s, figures in the low 0.40 range was normal, and Volvo saloons and estates of the early 2000s measured as low as 0.31Cd.
The XC90’s Cd wasn’t tragic, even in that context, at 0.40. But that’s not why it sat where it did.
Overall drag isn’t just about the coefficient, as you’ll probably know. Like drunkenness is a factor of both alcohol percentage and the amount you drink, drag is a factor of both the drag coefficient and the car’s size. The bigger the car’s frontal area (the bit that meets the air square on), the harder it is to push through the air.
In the 1960s, a typical Volvo had a frontal area of 1.75 square metres. That had risen to 2.2sqm by the early 2000s, but this gradual increase wasn’t enough to offset the gains in Cd. When the two numbers were multiplied to obtain a figure called CdA, typical overall drag was still steadily declining – until the XC90 arrived.
This SUV’s frontal area of around 2.75sqm was a good 25% bigger than other Volvos’ of the time. So while the CdA of a typical Volvo was 0.75 in 2000, the XC90’s was almost 1.1.
That’s 10% worse than even the PV544, a car with a bulky front, various addenda above and below its body and a rear that, while apparently sculpted, is sloped in a way that neither maintains an easy airflow nor cuts it off abruptly.