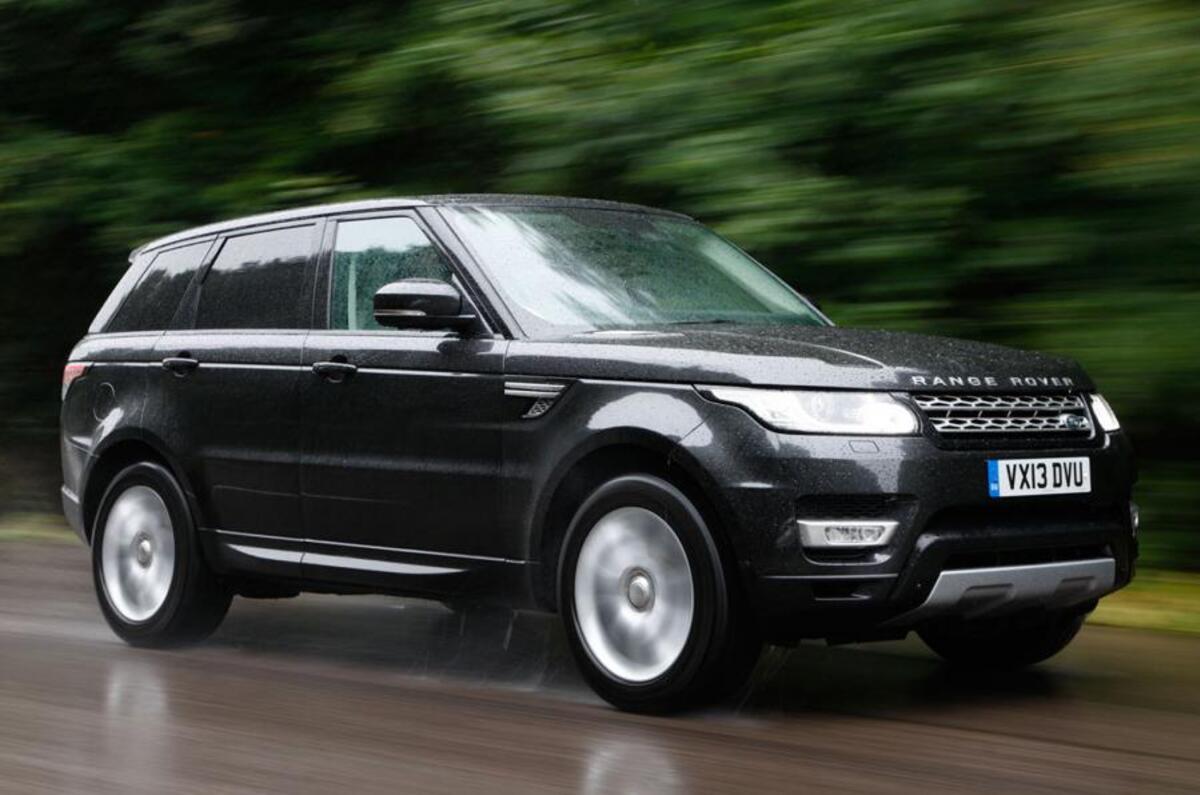
The Range Rover Sport has topped the list of the most stolen cars in 2015, according to figures from stolen vehicle recovery firm Tracker.
No less than eight of the models came from German manufacturers while the most sought after and successfully stolen vehicle was the Range Rover Sport, making up one of three Range Rovers in the list, including the Vogue and top-end Autobiography edition.
Of the cars targeted, SUVs make up 50%, also taking up the top three slots. The rest include Audis, BMWs, and Mercedes in the form of four saloons and one estate. Prices of the listed cars range from £25,610 for the BMW 3-Series to £92,450 for the Range Rover Autobiography.
Tracker also released information regarding the 10 regions most blighted by vehicle theft. Unsurprisingly, Greater London is the destination where most cars are stolen and recovered. Surrounding areas Essex, Hertfordshire, and Surrey are also targeted areas. Further North, Merseyside, and Leicestershire are ninth and 10th respectively, finishing off the list.
Car theft techniques have moved on significantly in recent years; in many cases, force isn't required to break into cars anymore. The absence of a traditional key, due to the introduction of keyless entry on many vehicles, makes cars increasingly susceptible to hacking.
This method now accounts for a sizeable proportion of stolen vehicles; in 2014, the Association of Police Officers published data that showed keyless thefts accounted for 44% of Land Rovers stolen.
Top 10 stolen cars in 2015
Range Rover Sport (2013-)
BMW X5 (2013-)
Range Rover Vogue (2013-)
Mercedes-Benz C 220 d (2014-)
BMW 3 Series (2012-)
Mercedes-AMG C 63 (2015-)
BMW 5 Series (2010-)
Audi RS4 (2012-2015)
Range Rover Autobiography (2013-)
Audi Q7 (2015-)
Top 10 regions where cars are stolen and recovered in 2015
Greater London
Greater Manchester
West Midlands
Essex
Kent
Surrey
West Yorkshire
Hertfordshire
Merseyside
Lancashire/Leicestershire
Lee Stern


Join the debate
Add your comment
I don't get keyless
I also don't see the keyless attraction. I have only had problems. One time I got stuck in The car as I couldn't find the key that had slipped out of my pocket down the side of the chair. Highly frustrating as I couldn't find the key but I obviously had it as I had had just driven there!
So I end up putting the key in one of the car cubbyholes. I explained this to a friend and she said, oh mines great I have a special cubby to put it. When I pointed out how is that any different to using the ignition slot as a place to put it she could t grasp the pointlessness of her keyless go.
Totally misleading commercial statistics
@Paul73
Deputy wrote: Apologies - I
Oh I certainly won't defend Autocar's online editorial standards! It normally smacks of regurgitation with little regard for sense checking, grammar checking or indeed spelling mistakes :)
Paul73 wrote: Deputy wrote:
I'm sorry but, I must disagree with the last point, they are very good at spelling mistakes.